GitLab's S-1
A customer analytics perspective

GitLab is a DevOps tool that provides a Git repository manager providing wiki, issue-tracking and continuous integration and deployment pipeline features. The company went public last month. GitLab's original IPO marketing range was $55 to $60 a share, subsequently adjusted upwards to $66 and $69 a share. It ended up pricing at $77 a share, and has been trading well above $100 a share.
Exhibit A: GitLab's share price performance
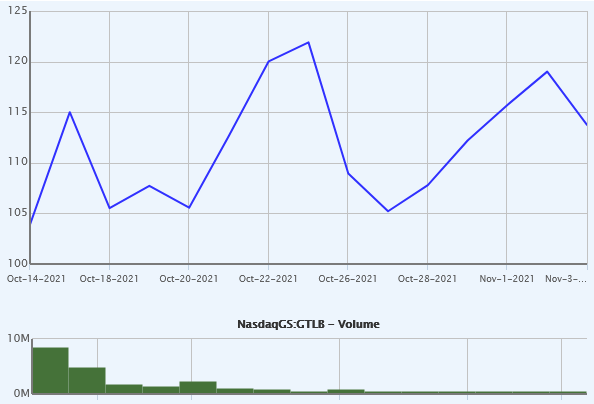
Source: CapitalIQ
I dive into GitLab's S-1 with a customer analytics lens.
Disclaimer: The following work is created and authored by me and is published and provided for informational and entertainment purposes only. The information below constitutes my own opinions. None of the information below constitutes a recommendation for any particular security.
Exhibit B: GitLab's Top Line Growth

Source: GitLab S-1
GitLab's top line growth has been impressive - a 15% CAGR in the last five quarters. However, this particular chart doesn't reveal anything about underlying cohort behavior.
Exhibit C: Cohort ARR

Source: GitLab S-1
Note: The cohort for a given year represents customers that made their initial subscription purchase in that year. GitLab's fiscal year ends on January 31. For example, the 2018 cohort represents all customers that bought their initial subscription between February 1, 2017 and January 31, 2018.
This is my favorite chart in GitLab's S-1. GitLab's 2015 customer cohort, which started with a minuscule revenue, generates over $25M of ARR currently. This is partly the power of the land-and-expand model. GitLab explains in its S-1,
"We employ a “land and expand” business strategy that focuses on efficiently acquiring new customers and growing our relationships with existing customers over time. We believe that as our customers realize the benefits of a single application approach, they will increase the use of The DevOps Platform, enhancing our ability to expand revenue generation within our existing customers over time. As a result of our approach, our Dollar-Based Net Retention Rate was 179% and 148% for fiscal 2020 and fiscal 2021, respectively. As of July 31, 2020 and 2021, our Dollar-Based Net Retention Rate was 153% and 152%, respectively."
GitLab offers a free tier, which encourages initial adoption of its product by developers. After overcoming the initial hurdle of adoption by perhaps an individual or several members of an organization, usage expands across teams and up to managers and executives who want additional features and therefore buy GitLab's paid Premium and Ultimate tier packages. It is also worth noting that GitLab was founded only 7 years ago and continuously adding new features to its plat in addition to geographic expansion, leading to more revenue opportunities.
At a first glance, GitLab's customer cohorts are doubling and quadrupling revenue every year before moderating to a stable growth rate seen in the 2015 cohort for example. My first hunch is that 1) GitLab likely has a long-ish CAC payback period 2) but that is okay, because each cohort stays with you a long time, generating a long, fat tail of cash flows.
Let's put GitLab's retention rates in context.
Exhibit D: Gross Retention Rates

Source: Sammy Abdullah at Blossom Street Ventures
Dollar-based gross retention represents how much revenue you lost to churn or downgrades. In GitLab's case, 97% of ARR on January 31, 2019 remained a year later on January 31, 2020. Impressive that only 3% of ARR was lost to churn and downgrade.
I like gross retention, because it shows how sticky your business is in raw terms. While most publicly traded SaaS companies report net retention, far fewer companies disclose gross retention. Presumably, companies opt not to disclose these numbers, unless they make them look good. Even benchmarked against these companies that opt in to disclose it, GibLab's retention appears competitive. GitLab's 97% gross retention benchmarks favorably to the peer group average of 95%.
Let's look at this a different way: net retention. Net retention is starting ARR + upgrades - downgrades - churn. This is a key metric for valuing SaaS companies.
Exhibit E: Net Retention Rates

Source: Sammy Abdullah at Blossom Street Ventures
Based on the above, a top quartile company's net retention at IPO is 120+%, with the median being 111%. GitLab's 12-month retention as of January 31, 2021 was 148%. GitLab continues to look great relative to peers.
While my favorite chart (Exhibit C) was helpful in drawing early insights, I'd like to work with numbers. Let's rely on the old art of pixel counting and recreate Exhibit C.
Exhibit F: My Favorite Chart Reproduced

Pretty close, right?
Acknowledging the imprecision introduced from pixel counting, the total ARR in 2020 is $101.5M. The total ARR from customers acquired in 2020 and before is $152.5M in 2021. The % increase is 50%, which roughly goes around with the S-1's quoted dollar-based net retention being 148%. The two percent difference is the margin of error from counting pixels.
Similarly, the total ARR in 2019 is $48.0MM. The total ARR from customers acquired in 2019 and before is $85.5M in 2020. The % increase is 78%, which roughly goes around with the S-1's quoted dollar-based net retention being 179% for this period. The one percent difference is my margin of error from counting pixels.
Now we know the numbers from pixel-counting are somewhat reliable, let's change the stacked area chart into a line graph by left-shifting each cohort.
Exhibit G: Cohort ARR

Except for the year 2017, every cohort's ARR line starts above the preceding year's cohort (except 2017). Also every line has a positive slope.
This growth pattern becomes more evident when each cohort's ARR is indexed to its first year.
Exhibit H: Cohort ARR Growth Over Time Indexed to the First Year

This shows the ARR growth of each annual cohort indexed to 1x. Since the 2015 cohort, which started at $1M and has grown to $37M by 2021, is going to the moon, I take the grey line off to observe the other years better.
Exhibit I: Cohort ARR Growth Over Time Indexed to the First Year (excluding 2015)

While the size of each ARR cohort is increasing, the growth of each successive cohort is also moderating, as shown in the decreasing slope from 2017 to 2019.
GitLab acquired its first $100,00 ARR customer in 2017 and its first $1M ARR customer in 2019. In 2020, the company formed its enterprise sales team and established partnerships with AWS and GCP in addition to key national system integrators and resellers. It is easier for caterpillars to double in size than whales. It makes sense that the growth profile (in multiple or percentage terms) of each successive cohort is moderating while presumably the average ARR per acquired customer trends up.
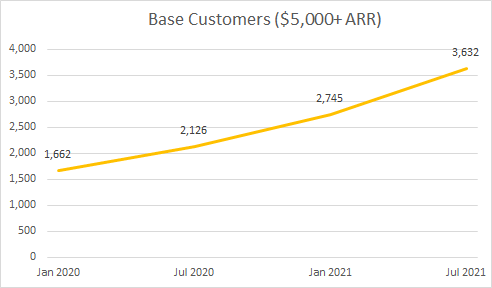
Exhibit J: Account Size

GitLab does not disclose the total number of customers. It only discloses "Base Customers", defined as customers generating $5,000 or more in ARR. This is understandable, given GitLab offers a free tier, which probably produces a long left tail of customers. The number of Base Customers is only available for the fiscal years 2020 and 2021. I divide ARR by the number of Base Customers for each year, resulting in approximately $61,000 and $64,000 for the fiscal years 2020 and 2021 respectively. Remember that this is overstated, given the denominator excludes customers generating less than $5,000 in ARR.
As shown below in Exhibit K, a Premium user pays $228 per year, and an Ultimate user pays $1,188 per year. S-1 doesn't provide information to allocate the $64,000 ARR per customer among Premium and Ultimate users. In other words, I'm not sure if an average account is comprised of, for example, 53 Ultimate users, or 30 Ultimate users plus 124 Premium users.
Exhibit K: GitLab Pricing

Exhibit L: Customer Acquisition


GitLab acquired its first $1.0M ARR customer two years ago in 2019. It currently has 27 customers generating $1.0M or more in ARR. As customers in the free tier convert to paid subscriptions and GitLab invests more resources in enterprise sales, I expect the average revenue per customer to continue trending up.
Exhibit M: Customer Base Breakdown

As shown in Exhibit M, GitLab's overall customer base is comprised of lots of small accounts (generating ARR below $100,000).
Overall, I am very impressed by GitLab's ARR growth, but how profitable is this?
Because we don't have all the numbers that we need from public disclosure, here are a few simplifying assumptions to facilitate some math:
100% of GitLab's sales and marketing costs are to acquire paying customers. In fact, some of the sales and marketing would target customers in the free tier and existing customers. This would result in a somewhat punitive CAC.
All of GitLab's customers are Base Customers ($5,000 or more in ARR).
85% customer retention rate
GitLab spent $154M in sales and marketing expenses for the fiscal year ending January 31, 2021. Given these assumptions, GitLab's customer acquisition cost for the year was approximately $115,680. The sensitivity table below shows how GitLab's CAC could change if we tweak assumptions on sales and marketing costs and retention.
Exhibit N: GitLab's Approximate CAC


From the stacked area chat that I reproduced (Exhibit F), we know that the customers acquired between January 2020 and January 2021 were generating approximately $23M of ARR at the end of January 2021.
I extrapolate the ARR of the 2020 cohort forward a couple of years using preceding cohorts' ARR growth rates. Applying GitLab's healthy contribution margin of 88%, the contribution margin from the first three years of the 2020 cohort add up to $140M. Given GitLab's sales and marketing spend of $154M for the fiscal year 2021, the CAC payback is slightly over three years.
A three-year CAC payback is a disappointing number on its own. Does this mean that GitLab's growth is less than profitable?
The short answer is no. Although CAC payback seems slow, GitLab shows such a stellar dollar net retention. Continued growth from maturing cohorts generate strong cash flow.
Exhibit O: My Favorite Chart Again

How profitable? I make a couple of assumptions to calculate LTV / CAC:
The 2020 cohort's spend increases at the same pace as the 2016 cohort, before moderating to YoY growth of 20% or less in the long term.
88% contribution margin
Exhibit P: Profitability (truncated)
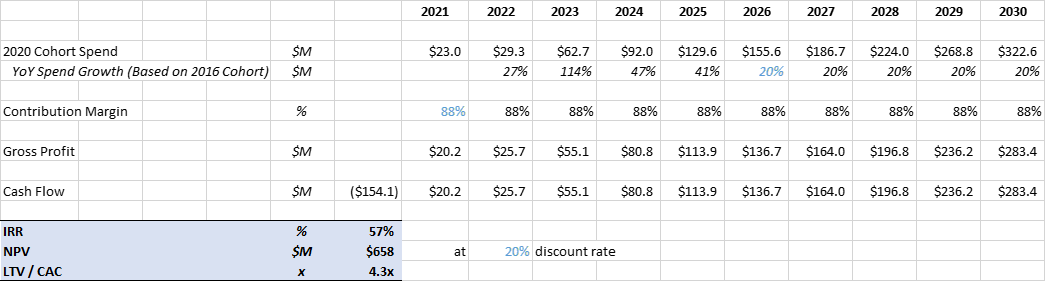
IRR is a whooping 57%! This is far above GitLab's cost of capital. This has to be a high number to cover GitLab's fixed costs and overhead, and it is. LTV-to-CAC is a healthy 4.3x. A healthy LTV-to-CAC ratio is usually around 3x to 5x.
Concluding Thoughts
Without more disclosure, it would be impossible to perform a comprehensive and accurate customer-based corporate valuation. Especially with these assumptions that I make for simplicity or to facilitate calculations, the numbers in my analysis are meant to guide insights not precision.
Nonetheless, the key takeaway stands. GitLab's land-and-expand sales strategy and strong customer retention feed a flywheel that harvests profitable economics from existing customers, which in turn are re-invested in acquiring new customers. As a result, here is a company that doesn't look great on net income given large sales and marketing spend. However, in the long term, customer economics are very profitable.